Post content:

Nevada offers a full complement of choices for homebuyers, and there is no single ‘best’ place to buy a home in the state. There are homes and programs designed to meet nearly everyone’s needs.
From condos on the Vegas Strip to scenic mountain views of Carson City to the quiet rural stretches of the Great Basin, Nevada has it all. AD Mortgage did a deep dive into the Nevada housing market, spoke to experts in the state, and narrowed the list with some of the best places to buy a home in Nevada in 2026.
For upscale properties with an urban lifestyle, read our report on Las Vegas, or check out our Top Neighborhoods reports for Carson City and Henderson. We encourage you to take a look at our choices, then work with a local realtor and mortgage professional when narrowing your search.
Nevada Real Estate Market Overview
We examined multiple factors when putting together the report to present a broad overview of positives and negatives for homebuyers, realtors, and mortgage professionals.
The full range of research is in the downloadable PDF. However, here is a list of the components that we explored and took into consideration when compiling the information in the report:
- Median Home Prices
- Homebuying Entry Costs
- Taxes and Insurance
- Median Incomes
- Cost of Living
- Location
- Down Payment Assistance (DPA) Programs
- Interviews with Realtors and Mortgage Professionals
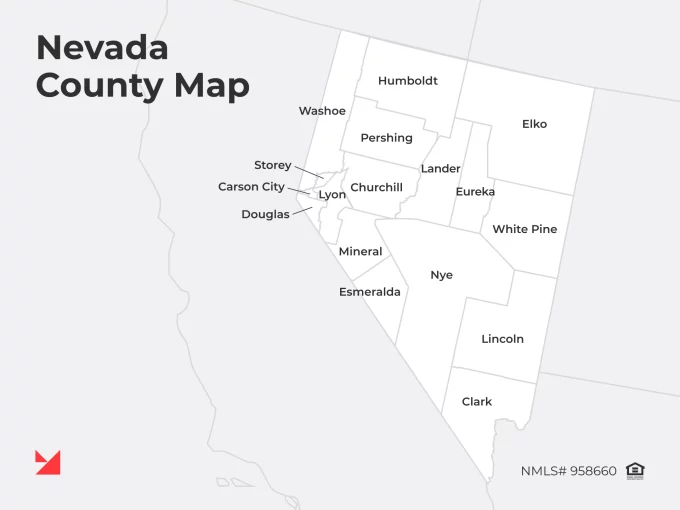
For Nevada, we focused on counties in many cases but added additional information on the larger cities and some others that we consider to be hidden gems.
We provide an excellent overview here with our assessment. Of course, you can access the previously mentioned full set of accumulated data here for a more detailed look to meet your individual needs.
It is important to note that our selections for the best locations to buy a home in Nevada are based on the factors listed above, the available 2025 data, and that this list is not definitive. Instead, it should serve as a starting point for those researching housing options in Nevada.
If you want to cheat, you can scroll to the bottom to see our top choices. However, to get an excellent understanding of the Nevada home market, some informative charts below provide a more detailed look at everything Nevada has to offer.
The Price of Buying and Owning a Home in Nevada
The first thing most homebuyers consider is the cost of housing. Therefore, we chose to begin our evaluation with the entry cost of housing in Nevada, sorted by county. The table below provides the average down payment needed for a typically priced home broken down by county. We then created a column dividing each county into tiers based on the entry cost.
Price to Enter: Cost of Buying a Home in Nevada
| County | Typical Home Value | Est DP 3% | Est DP 5% | Entry Cost Tier |
|---|---|---|---|---|
| Douglas | $678,000 | ~$20,300 | ~$33,900 | Very High |
| Washoe | $556,000 | ~$16,700 | ~$27,800 | High |
| Carson City | $486,000 | ~$14,600 | ~$24,300 | Mid |
| Storey | $459,000 | ~$13,800 | ~$23,000 | Mid |
| Clark | ~$450,000 | ~$13,500 | ~$22,500 | Mid |
| Lyon | $404,000 | ~$12,100 | ~$20,200 | Mid |
| Churchill | $380,000 | ~$11,400 | ~$19,000 | Mid |
| Elko | $358,000 | ~$10,700 | ~$17,900 | Mid |
| Nye | $353,000 | ~$10,600 | ~$17,650 | Mid |
| Humboldt | $335,000 | ~$10,050 | ~$16,750 | Lower |
| Lander | $237,000 | ~$7,100 | ~$11,900 | Low |
| Pershing | $227,000 | ~$6,800 | ~$11,350 | Low |
| Lincoln | $221,000 | ~$6,600 | ~$11,050 | Low |
| White Pine | $179,000 | ~$5,400 | ~$8,950 | Very Low |
| Eureka | $132,000 | ~$4,000 | ~$6,600 | Very Low |
| Mineral | $119,000 | ~$3,600 | ~$6,000 | Very Low |
| Esmeralda | ~$103,000 | ~$3,100 | ~$5,150 | Very Low |
Lower home prices don’t always translate into lower monthly ownership costs. In Nevada, insurance and tax structures compress long-term affordability, making some mid-priced counties more predictable than lower-priced rural markets.
We researched typical home value and grouped it with property taxes and property insurance to provide the core data borrowers need: Principal, interest, taxes, and insurance (PITI).
“The data aligns closely with what we see on the lending side every day: Nevada offers strong options for nearly every type of buyer, but understanding the local differences is key to making the right decision.”
Sam Gabay

Sam Gabay is a mortgage professional at Merit Lending.
Cost to Hold: Ongoing Ownership Costs by County
| County | Median Property Tax | Est Insurance | Annual Cost | Monthly Cost | Cost % of Value |
|---|---|---|---|---|---|
| Douglas | $1,745 | ~$1,165 | ~$2,910 | ~$243 | ~0.43% |
| Washoe | $1,889 | ~$1,265 | ~$3,150 | ~$263 | ~0.57% |
| Carson City | $1,224 | ~$1,210 | ~$2,434 | ~$203 | ~0.50% |
| Storey | $1,380 | ~$1,300 | ~$2,680 | ~$223 | ~0.58% |
| Clark | $1,841 | ~$1,445 | ~$3,285 | ~$274 | ~0.73% |
| Lyon | $1,841 | ~$1,190 | ~$3,030 | ~$253 | ~0.75% |
| Churchill | $1,202 | ~$1,210 | ~$2,412 | ~$201 | ~0.63% |
| Elko | $1,202 | ~$1,190 | ~$2,392 | ~$199 | ~0.67% |
| Nye | $1,143 | ~$1,255 | ~$2,398 | ~$200 | ~0.68% |
| Humboldt | $862 | ~$1,100 | ~$1,962 | ~$164 | ~0.59% |
| Lander | $733 | ~$1,215 | ~$1,948 | ~$162 | ~0.82% |
| Pershing | $967 | ~$1,305 | ~$2,272 | ~$189 | ~1.00% |
| Lincoln | $761 | ~$1,305 | ~$2,066 | ~$172 | ~0.94% |
| White Pine | $622 | ~$1,145 | ~$1,767 | ~$147 | ~0.99% |
| Eureka | $432 | ~$1,305 | ~$1,737 | ~$145 | ~1.32% |
| Mineral | $1,007 | ~$1,305 | ~$2,312 | ~$193 | ~1.94% |
| Esmeralda | $414 | ~$1,305 | ~$1,719 | ~$143 | ~1.67% |
Location, Location, Location
Where you live and how much it costs to live there is often a significant factor for most people when purchasing a home. Despite our ability to work remotely, have home movie nights, or shop online, people still value the opportunity to visit their favorite restaurants, entertainment venues, and enjoy their chosen recreational activities.
Access to excellent healthcare, airports, schools, and other services also plays a part in homebuying decisions.
We took a thorough look at the cost of living and the wide variety of location options in Nevada and found that ‘location’ was the hardest to quantify out of all our metrics. Therefore, we consulted local experts to help narrow our overall rankings.
“As a Nevada mortgage broker working across both urban and rural markets, I can confirm that ‘location value’ in this state is incredibly nuanced. Two buyers with the same budget can have completely different experiences depending on whether they prioritize taxes, commute times, recreation, or long‑term appreciation. What stood out most in this analysis is how accurately it reflects the diversity of Nevada’s housing landscape.”
Sam Gabay
Initial Results
While the tables above don’t paint a complete picture of where to buy in Nevada, they do present a great starting point in understanding the costs associated with various counties in the state.
Like most states, property values in Nevada vary dramatically by county with less populated rural locations being the least costly. Of course, living in Nevada’s western deserts aren’t ideal for everyone despite the affordability of Mineral and Esmeralda counties.
Interestingly, property tax rates don’t correlate directly to urban vs. rural counties as they do in many states. Mineral, Nye, and Lander counties are at or near the highest in the state despite lower populations.
However, insurance premium ranges in Nevada were mostly unremarkable. The data shows that insurance across all counties remained comparable. This is likely due to the lack of disaster-prone areas within the state.
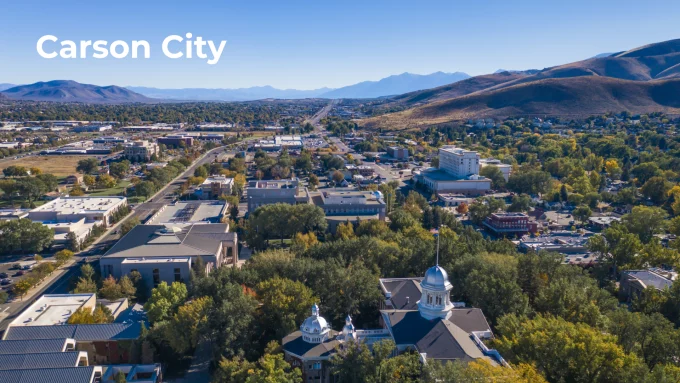
Taking all the collected data into account, we selected Carson City County as our top pick for Nevada. This was based on a ‘deep dig’ that considered some other important variables. Nonetheless, continue reading about some of our other selections of cities and counties and why they are worth a look.
Carson City & County
Carson City County was an early standout in our evaluation due to its low property tax rate combined with proximity to urban infrastructure and amenities. Additionally, its average home value is only slightly above the national average, which solidifies it as our top overall pick for this list.
Take a look at some of the Top Neighborhoods in Carson City.
| City | Carson City & County |
|---|---|
| Typical Home Value | $486,000 |
| Est. DP 3% | ~$14,600 |
| Est. DP 5% | ~$24,300 |
| Median Property Tax | $1,224 |
| Est. Insurance | ~$1,210 |
| Annual Ongoing Costs | ~$2,434 |
| Monthly Ongoing Costs | ~$203 |
| Ongoing Costs to Value | ~0.50% |
| Population | 58,148 |
| Median Household Income | $71,809 |
Carson City and County tops our list as it presents the best balance of all the factors we evaluated, especially location.
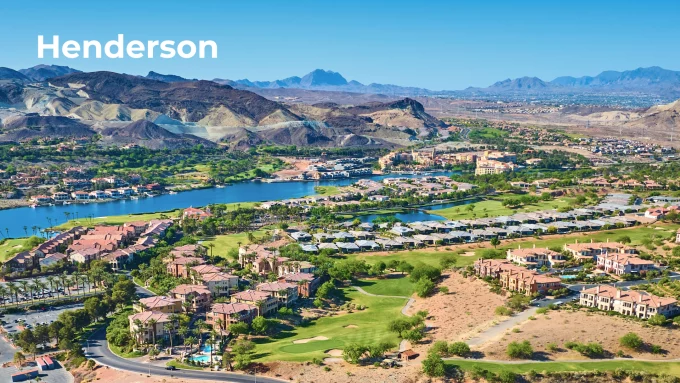
Henderson
Henderson has a great deal to offer for homebuyers. Its proximity to Las Vegas, local amenities, and modern infrastructure all contributed in making it our second choice for this list.
Check out this article on the top neighborhoods in Henderson for a more detailed look at the community.
| City | Henderson |
|---|---|
| Typical Home Value | $487,098 |
| Est. DP 3% | $14,433 |
| Est. DP 5% | $24,056 |
| Median Property Tax | $1,224 |
| Est. Insurance | ~$1,210 |
| Annual Ongoing Costs | ~$2,434 |
| Monthly Ongoing Costs | ~$203 |
| Ongoing Costs to Value | ~0.50% |
| Population | 350,039 |
| Median Household Income | $95,415 |
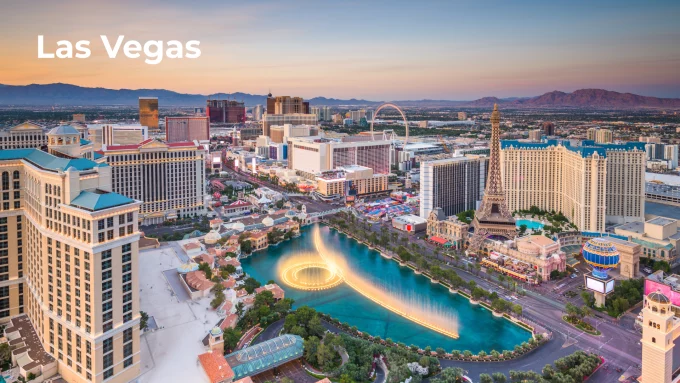
Las Vegas
The largest city in Nevada makes our top 3 for many reasons. Vegas is in the top of several of the metrics that we examined. It offers the most diverse range of housing prices, income potential, and the ability to ‘trade up’ over time without resettling in another locale. Additionally, there are a number of local down payment assistance (DPA) programs available to Vegas citizens.
The city long ago evolved from its roots as the gambling Mecca and now hosts a much more complete city balance. Banking, investment, entertainment, and even professional sports have made a major impact on overall attractiveness.
| City | Las Vegas |
|---|---|
| Typical Home Value | $420,894 |
| Est. DP 3% | $12,627 |
| Est. DP 5% | $21,045 |
| Median Property Tax | $1,224 |
| Est. Insurance | ~$1,210 |
| Annual Ongoing Costs | ~$2,434 |
| Monthly Ongoing Costs | ~$203 |
| Ongoing Costs to Value | ~0.50% |
| Population | 678,922 |
| Median Household Income | $70,723 |
Mesquite
Mesquite is a slightly hidden gem in our estimation of the Nevada housing market. It has a small population, but decent median income levels, reasonable housing prices.
Mesquite accomplishes this without losing much in location value. It is close enough to Las Vegas if needed, but far enough away to manage its own growth and maintain its own identity. It also features excellent access to rivers, lakes, and parks in Nevada and across the border in Arizona or Utah.
The city maintains a 1st time homebuyer DPA of up to $10,000, which exceeds the median 3% down payment and is just short of the median 5% level.
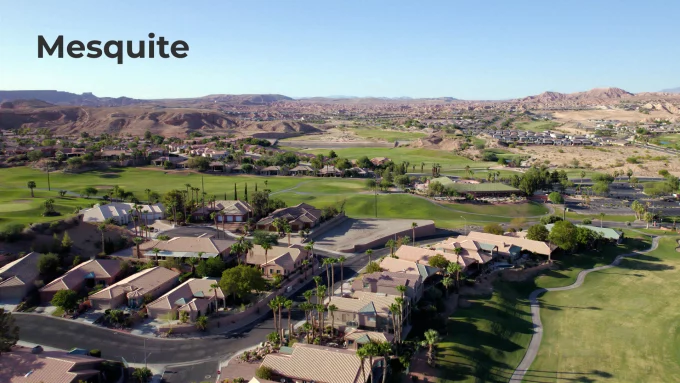
| City | Mesquite |
|---|---|
| Typical Home Value | $256,055 |
| Est. DP 3% | $7,682 |
| Est. DP 5% | $12,803 |
| Median Property Tax | $1,841 |
| Est. Insurance | ~$1,445 |
| Annual Ongoing Costs | ~$3,285 |
| Monthly Ongoing Costs | ~$274 |
| Ongoing Costs to Value | ~0.73% |
| Population | 22,059 |
| Median Household Income | $75,227 |
Sparks and Reno
Sparks and Reno are Nevada’s ‘sister cities’. Despite their close proximity, similar median housing prices and down payment costs, they are each unique and make this list for different reasons.
Ask most locals and they will likely confirm the distinct differences in lifestyle and attractiveness of both cities.
As for our research, we noted the value of the over 10% higher median income in Sparks over Reno and a slightly lower median cost in housing. This provided an edge in our assessment.
That being said, Reno and Sparks both provide easy access to a modern city environment with a broad range of outdoor activities close at hand. For Reno, that would be Lake Tahoe, the Truckee River, and a thriving urban scene. Whereas, Sparks offers more suburban appeal with a variety of cultural events and family entertainment venues.
Both cities offer a range of DPA options from local and state funded sources and the housing options are broad enough to meet nearly every homebuyer’s individual needs and situation.
Sparks
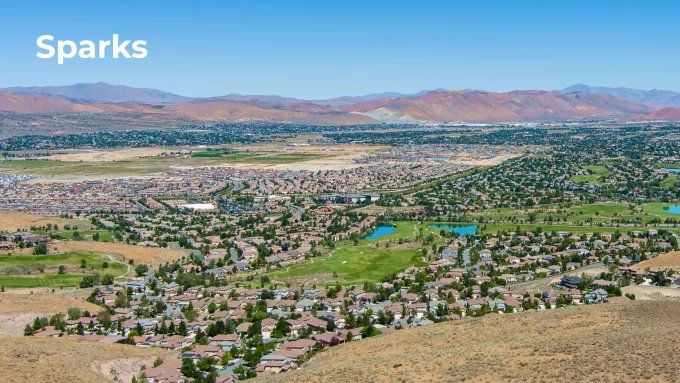
| City | Sparks |
|---|---|
| Typical Home Value | $516,930 |
| Est. DP 3% | $15,508 |
| Est. DP 5% | $25,847 |
| Median Property Tax | $1,889 |
| Est. Insurance | ~$1,265 |
| Annual Ongoing Costs | ~$3,150 |
| Monthly Ongoing Costs | ~$263 |
| Ongoing Costs to Value | ~0.57% |
| Population | 111,523 |
| Median Household Income | $91,545 |
Reno
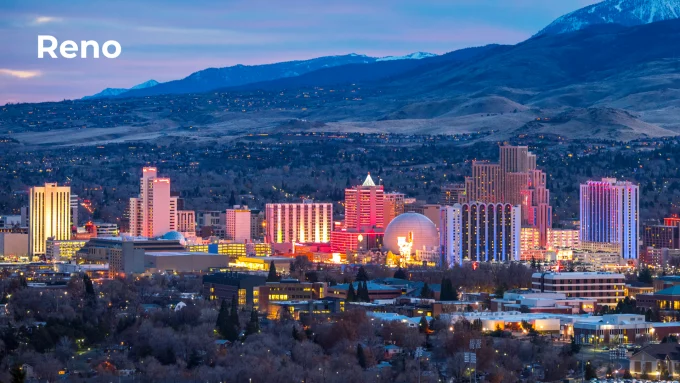
| City | Reno |
|---|---|
| Typical Home Value | $552,392 |
| Est. DP 3% | $16,572 |
| Est. DP 5% | $27,620 |
| Median Property Tax | $1,889 |
| Est. Insurance | ~$1,265 |
| Annual Ongoing Costs | ~$3,150 |
| Monthly Ongoing Costs | ~$263 |
| Ongoing Costs to Value | ~0.57% |
| Population | 264,165 |
| Median Household Income | $80,760 |
Hidden Rural Gems
We close out our list with several smaller rural cities spread throughout Nevada. These cities make the list based on excellent affordability, a wide range of state and local DPA programs, and relative median income.
For homebuyers looking to escape the hustle and bustle of larger cities these options are worth a serious look. Each of them has easy access to state or interstate highways, modern amenities, and welcoming local communities. For outdoorsy work from home professionals, artists, or retirees, the following list may provide the ideal circumstances while maximizing purchasing power.
Eureka
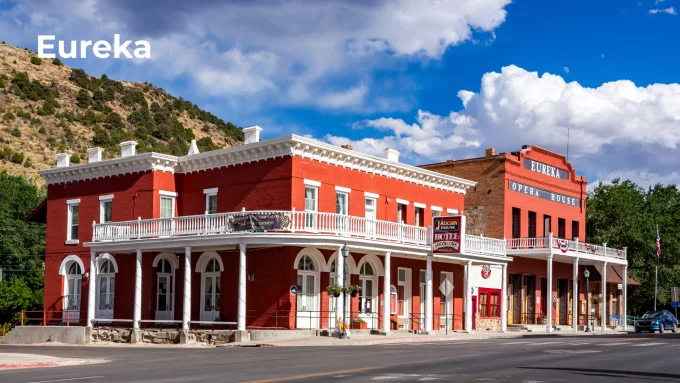
| City | Eureka |
|---|---|
| Typical Home Value | $401,606 |
| Est. DP 3% | $12,048 |
| Est. DP 5% | $20,080 |
| Median Property Tax | $432 |
| Est. Insurance | ~$1,305 |
| Annual Ongoing Costs | ~$1,737 |
| Monthly Ongoing Costs | ~$145 |
| Ongoing Costs to Value | ~1.32% |
| Population | 26,512 |
| Median Household Income | $57,662 |
Fallon
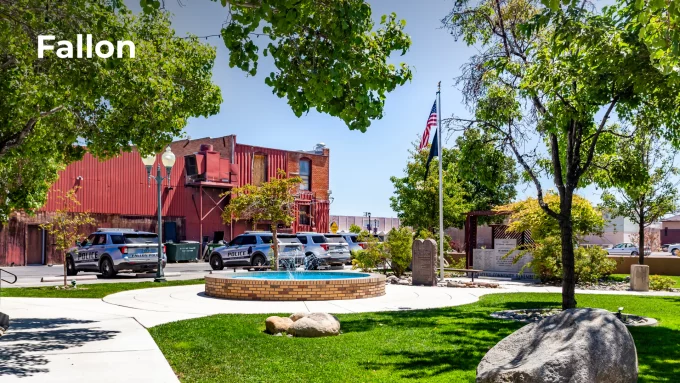
| City | Fallon |
|---|---|
| Typical Home Value | $379,408 |
| Est. DP 3% | $11,382 |
| Est. DP 5% | $18,970 |
| Median Property Tax | $1,202 |
| Est. Insurance | ~$1,210 |
| Annual Ongoing Costs | ~$2,412 |
| Monthly Ongoing Costs | ~$201 |
| Ongoing Costs to Value | ~0.63% |
| Population | 9,463 |
| Median Household Income | $73,389 |
Hawthorne
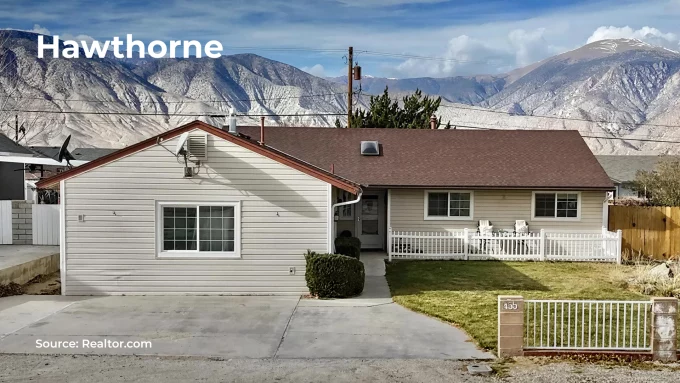
| City | Hawthorne |
|---|---|
| Typical Home Value | $120,398 |
| Est. DP 3% | $3,612 |
| Est. DP 5% | $6,020 |
| Median Property Tax | $1,007 |
| Est. Insurance | ~$1,305 |
| Annual Ongoing Costs | ~$2,312 |
| Monthly Ongoing Costs | ~$193 |
| Ongoing Costs to Value | ~1.94% |
| Population | 2,809 |
| Median Household Income | $67,300 |
Ely
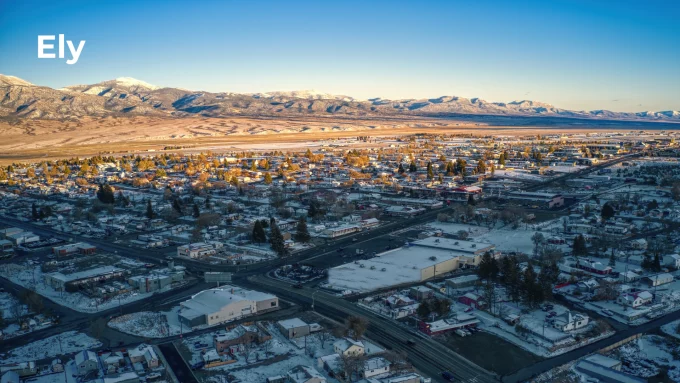
| City | Ely |
|---|---|
| Typical Home Value | $195,964 |
| Est. DP 3% | $5,879 |
| Est. DP 5% | $9,798 |
| Median Property Tax | $622 |
| Est. Insurance | ~$1,145 |
| Annual Ongoing Costs | ~$1,767 |
| Monthly Ongoing Costs | ~$147 |
| Ongoing Costs to Value | ~0.99% |
| Population | 3,929 |
| Median Household Income | $77,500 |
Battle Mountain
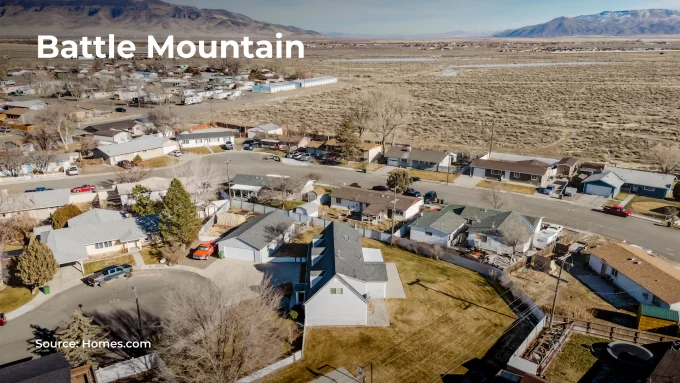
| City | Battle Mountain |
|---|---|
| Typical Home Value | $276,528 |
| Est. DP 3% | $8,296 |
| Est. DP 5% | $13,826 |
| Median Property Tax | $733 |
| Est. Insurance | ~$1,215 |
| Annual Ongoing Costs | ~$1,948 |
| Monthly Ongoing Costs | ~$162 |
| Ongoing Costs to Value | ~0.82% |
| Population | 3,518 |
| Median Household Income | $81,857 |
Thank you!
We’ll contact you as soon as possible
Oops, something went wrong
Please try to send form again


