
Post content:
California Housing Market Report: Q3 2026 Data
Share Your Voice Take Our Year-End Survey to Get 500 Loyalty Points and Exclusive Summary
TAKE SURVEY
In the third quarter, California’s housing market cooled. Homes that sold in 46 days back in Q2 took a full week longer in Q3, and the state’s median sale price pulled back roughly $22,000 from its spring high. By the end of Q3, buyers had more room to negotiate.
In this report, we cover:
- Where California home prices stand after the Q3 pullback, and whether the decline is likely to continue into Q4
- Why coastal metros like the Bay Area and San Diego behave so differently from inland markets like Sacramento and Riverside
- What’s driving longer days on market and more price cuts – and how much negotiating room that gives buyers
- How California’s sales volume still compares to pre-pandemic levels, and the role the mortgage rate lock-in effect plays in keeping inventory thin
- What it takes to afford a median-priced home across California’s counties, and how credit score shifts the math
- Where the market could be headed through Q4 2026 and into 2027
Ready to put these numbers to work? Become a Partner with AD Mortgage and receive access to loan programs that fit your California borrowers
California Housing Market at a Glance:
Q2 vs Q3 2026
Metric Q2 2026 Q3 2026 Quarterly Change Source Median Sale Price (single-family homes) $916,750 $894,630 −2.4% California Association of Realtors (C.A.R.) Sales-weighted Average prices $858,174 $824,358 −3.9% Zillow Housing Data, the Median Sale Price table Estimated home sales 79,348 73,176 −7.8% Zillow Housing Data, the Sales Count table New listings 104,634 92,010 −12.1% Realtor.com, Monthly Housing Inventory Median days on market 46.3 days 53.3 days +7 days Realtor.com, Monthly Housing Inventory Unsold Inventory Index (UII) (months of supply) 3.3 months 3.6 months +0.3 months California Association of Realtors (C.A.R.) Homeownership rate 54.3% 54.3% No change US Census Bureau, Housing Vacancy Survey Rental share 45.7% 45.7% No change US Census Bureau, Housing Vacancy Survey Affordability index 19% 19% No change California Association of Realtors (C.A.R.)
As California job market keeps adding workers, its population is shrinking. The state’s population slipped by about 9,500 from mid-2024 to mid-2025, down to 39,355,309, according to the U.S. Census Bureau.
Statewide nonfarm employment held essentially steady from Q2 2026 to Q3 2026 (18,154,600 to 18,150,100), but is still up 0.7% year over year, per the Bureau of Labor Statistics. At the same time, per BLS wage data, the average weekly wage climbed to $1,954 as of Q4 2025 (the most recent available data).
For mortgage brokers, that combination is worth exploring, because wage growth alone doesn’t solve affordability. A borrower whose income looks solid on paper can still come up short once taxes, insurance, and a realistic debt-to-income ratio enter the picture, especially in the state’s higher-cost counties.
California Home Price Trends
Sales-Weighted Home Price Trends in 2026
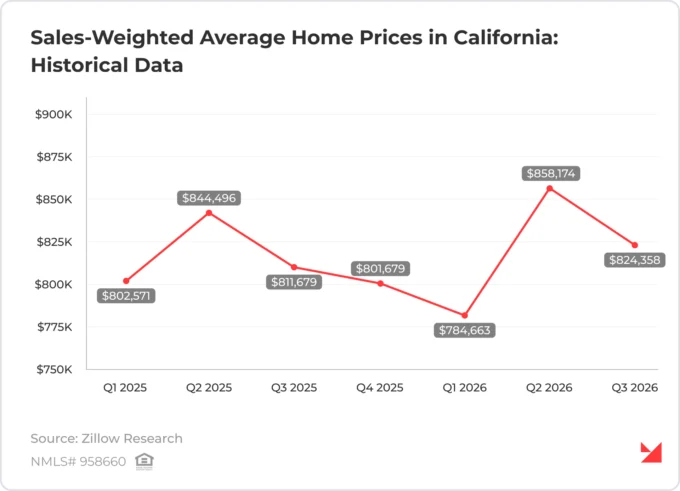
California’s statewide home prices have followed a clear seasonal pattern so far in 2026:
A dip early in the year → a spring peak → then a pullback
The sales-weighted average price opened the year at $784,663 in Q1 (the lowest point of 2026), climbed 9.4% to a year-high of $858,174 in Q2, then eased back 3.9% to $824,358 in Q3.
A few practical seasonal factors likely explain this pattern. Heading into Q4, fewer buyers and sellers want to move around the November-December holidays, and California’s rainy season typically starts around the same time. They both likely contribute to prices and sales activity cooling off through the end of the year and carrying that softness into Q1.
In Q2, the rain typically eases, homes show better, and families often aim to close before the new school year begins. And tax refunds, which usually arrive earlier in the year, provide buyers with extra cash for a down payment right as spring listings pick up. This partially explains why we usually witness spikes in Q2.
Coastal vs Inland Price Performance
For this breakdown:
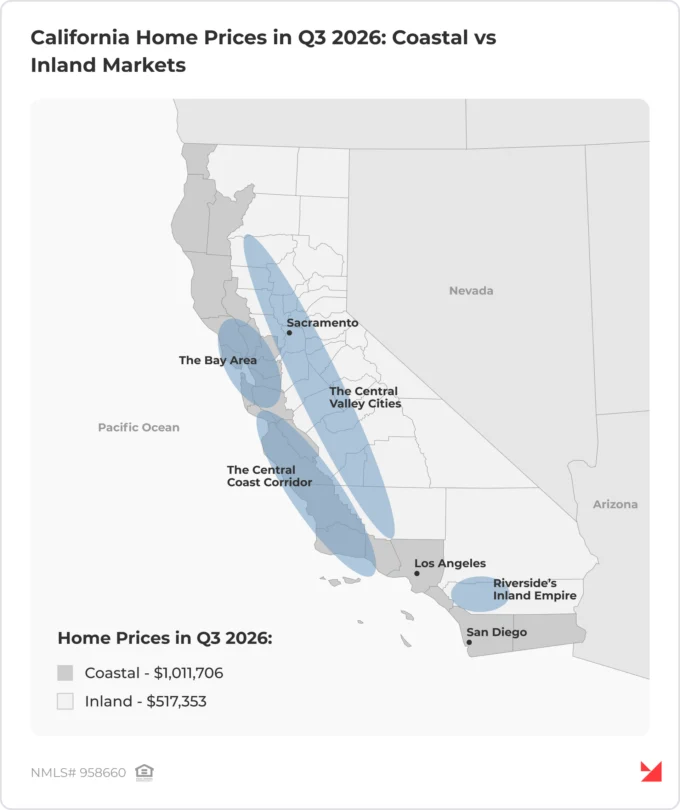
- Coastal California covers the state’s 11 ocean-adjacent markets – Los Angeles, the Bay Area (San Francisco, San Jose, Santa Rosa, Vallejo), San Diego, and the Central Coast corridor (Santa Barbara/Santa Maria, Santa Cruz, Salinas, San Luis Obispo, Oxnard).
- Inland California covers the state’s valley and interior markets – Sacramento, Riverside’s Inland Empire, and the Central Valley cities (Fresno, Bakersfield, Stockton, Modesto, Visalia, Merced, Chico, Redding, Yuba City, Madera)
Q2 2026 Q3 2026 Quarterly Change Share of Statewide Sales Coastal $1,057,873 $1,011,706 −4.4% ~62% Inland $521,167 $517,353 −0.7% ~38%
Splitting the California housing market this way shows that the statewide number is hiding two different stories.
Borrowers in coastal areas face higher home prices – approximately twice those in inland areas. Coastal metros also recorded a larger quarterly price decline. Coastal metros’ weighted average sale price dropped from $1,057,873 in Q2 2026 to $1,011,706 in Q3, which is a decline of 4.4%.
Meanwhile, Inland metros barely moved over the same stretch, slipping just 0.7%, from $521,167 to $517,353. According to Zillow, homes sold told the same story: coastal home sales fell from 49,824 to 45,444 (−8.8%), while inland sales eased from 29,524 to 27,732 (−6.1%).
Are Home Prices Dropping in California?
Home prices did decline in Q3 compared to Q2 2026. The same pattern held for both coastal and inland markets. Year over year, though, the picture is not as clear-cut.
California’s home price in Q3 2026 was $824,358, which is higher than Q1, Q3, and Q4 2025. That is above what borrowers saw for most of 2025.
Still, if 2026 follows the same pattern as 2025, home prices could keep declining into Q4 2026. This is partly explained by the seasonality we discussed above.
Sales and Inventory in California
Home Sales vs Pre-Pandemic Levels
California’s home sales volume still hasn’t recovered to where it stood before the pandemic. Using Zillow Historical Data, we compared the same quarters to 2019 (the last full year before COVID reshaped the housing market) and found a consistent gap.
Quarter 2019 sales 2026 sales Change Q1 74,775 56,787 −24.1% Q2 108,564 79,348 −26.9% Q3 106,346 73,176 −31.2% Q4 94,399 – –
Q1 2026 sales ran 24.1% below Q1 2019, Q2 2026 came in 26.9% lower, and Q3 2026 was down 31.2%. If anything, the gap has widened rather than closed: Q3 2026’s shortfall is larger than Q1’s or Q2’s.
At the same time, California’s average sale price has climbed roughly 49-52% since 2019, even as sales volume has stayed a quarter or more below pre-pandemic levels.
Quarter 2019 price 2026 price Change Q1 $526,735 $784,663 +49.0% Q2 $566,209 $858,174 +51.6% Q3 $552,608 $824,358 +49.2%
In short, home values have grown dramatically since 2019, even as far fewer Californians are actually buying and selling.
The Rate Lock-In Effect
The mortgage rate lock-in effect occurs when homeowners are reluctant to sell because replacing their existing mortgage would mean borrowing at a higher rate. This can constrain new listings and transaction activity. Homeowners who refinanced or bought at the low rates of 2020-2021 are reluctant to sell and give those rates up, which keeps inventory tight and buyers competing over a smaller pool of listings. Home inventory in California averaged 74,023 active listings in Q3 2026, down 2.9% year over year from 76,254 in Q3 2025.
Keep in mind that it is a possible explanation for the pattern, though we can’t confirm the exact cause from sales and price data alone.
Days on Market, Price Cuts, and Negotiating Room
In Q3 2026, California homes took noticeably longer to sell than they did in Q2. Median days on market (DOM) rose from 46.3 days to 53.3 days. And, according to Realtor.com Monthly Housing Inventory data, the share of active listings with a price cut moved the same direction, climbing from 15.6% in Q2 to 18.3% in Q3. Together, these indicators describe a cooling market.
Looking at the annual pattern, Q2 stands out as the fastest-selling quarter two years running: 45.0 days in 2025, 46.3 days in 2026. Q4 2025 was the opposite extreme, the slowest quarter of that year at 62.0 days. If the pattern holds, Q4 2026 would likely be this year’s slowest quarter too.
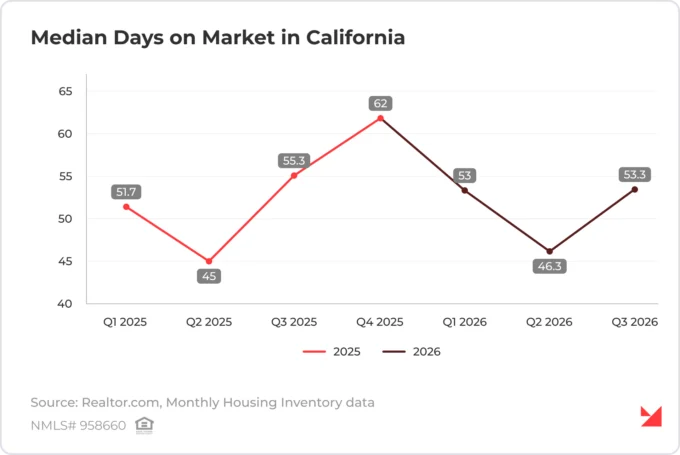
An important observation: Price and days on market have a strong negative relationship across Q1 2025 – Q3 2026. When the market heats up in Q2, homes sell both faster and for more, and as that heat fades into Q3, the same cooling shows up on both sides at once – prices pull back while days on market climbs.
Broker takeaway: A Q3 listing that is sitting longer and carrying a price cut is part of a seasonal pattern repeating from last year. For buyers without a hard deadline tied to the school calendar or a lease, Q3’s slower pace and higher price-cut share can mean real negotiating room – just with a smaller pool of listings than Q2 offered.
Have a buyer who’s flexible on timing and ready to negotiate? Submit a scenario!
Affordability: Income Needed to Buy in California in Q3 2026
For many Californians, buying a home might still be a stretch, even with a solid income. Let’s take a closer look at the numbers.
Income Needed to Buy a Median-Priced Home
In Q3 2026, just 19% of California households could afford the state’s median-priced existing single-family home, according to C.A.R. At a statewide median home price of $894,630, that meant an annual household income of about $228,000 to cover a $5,700 monthly payment, including principal, interest, taxes, and insurance. The calculation also assumes a 20% down payment (roughly $179,000 before closing costs).
The Geography of Purchase
The statewide numbers are a useful starting point, but they don’t tell you what buying looks like in every community. In Q3, the income needed to afford a median-priced single-family home ranged from $56,000 in Lassen County to $578,400 in San Mateo County.
County Minimum annual household income Share of households able to afford a median-priced home San Mateo $578,400 19% Orange $374,400 15% San Diego $274,000 16% Sacramento $140,000 33% Fresno $110,800 34% Lassen $56,000 61%
Under C.A.R.’s affordability assumptions, the income needed to purchase a median-priced home was $56,000 in Lassen County and $110,800 in Fresno County.
By the way, buying in Fresno could pay off over time. AD Mortgage’s 10-Year Rent vs. Buy Wealth Study found that buying came out $51,770 ahead of renting and investing the savings over 10 years. Curious how other California cities compare? Explore this and other AD Mortgage original studies.
Credit Scores and Mortgage Costs for Californians
Income and savings are not the only pieces of the puzzle. A stronger credit score can also reduce the cost of financing. In AD Mortgage’s February 2026 Credit Score vs. Mortgage Cost study, we estimated that improving a borrower’s FICO score from 722 (the California average used in the analysis) to 760 could save $42,753 in interest over a 30-year mortgage. In that scenario, the modeled rate fell from 6.74% to 6.46%.
It illustrates why credit preparation matters. Even a small improvement in credit score can save thousands of dollars over the life of the loan.
See what your borrower’s credit score could mean for their rate. Run their numbers through our Quick Pricer to check what they could preliminarily qualify for today.
California Housing Market Forecast for Q4 2026 and 2027
Based on the pattern we have tracked, Q4 2026 might repeat what happened in Q4 2025. Price and sales volume could both hit their seasonal lows, while homes take even longer than usual to sell.
Seasonal patterns may continue into 2027. The data reviewed show Q2 price peaks in 2025 and 2026, followed by declines through Q4 2025 and Q3 2026, respectively. Sales volume remained approximately 24-31% below the corresponding 2019 levels across the three quarters reviewed. Mortgage rate lock-in may contribute to that shortfall. If rates ease, some owners who have delayed selling may decide to list.
Before the year ends, help buyers assess whether local market conditions offer opportunities to negotiate on price or terms. Speak with our Account Executives to find the best loan program match for your clients.
According to Realtor.com data, California had 74,607 homes for sale in September 2026, up slightly (+0.6%) from a year earlier. Newly listed homes came in at 30,094, down 1.1% year over year. The median listing price was $725,000, down 3.1% from September 2025. At the same time, the sales-weighted average across the state’s largest metros actually rose 2.1% year over year, to $831,746. Homes also moved a bit faster than a year ago, with a median of 55 days on market versus 58 in September 2025. California’s homeownership rate was 54.3% in Q3 2026, according to the U.S. Census Bureau. In other words, just over half of households lived in a home they owned, while the remaining 45.7% rented. Yes. CalHFA’s MyHome program offers eligible first-time buyers a deferred-payment loan of up to 3% with a CalHFA conventional mortgage or 3.5% with a CalHFA FHA mortgage to help cover the down payment and closing costs. AD Mortgage’s approved-assistance list includes local programs in Concord, Grass Valley, Simi Valley and Napa County. Eligibility, funding, and compatibility with your mortgage should be confirmed before applying.
FAQ: California Housing Market
How was the housing market in California in the last month of Q3?
What is the homeownership rate in California?
Are there down payment assistance programs for California homebuyers?