
Missouri Housing Market in Q3 2026: Key Numbers and Facts for Brokers and LOs
| Share Your Voice |
|---|
| Take Our Year-End Survey to Get 500 Loyalty Points and Exclusive Summary TAKE SURVEY |
Missouri’s market was relatively stable throughout the third quarter of 2026. However, several indicators, including active listings, showed more substantial changes.
Today’s report analyzes the key housing market indicators and highlights what brokers and loan originators should watch in the fourth quarter of 2026.
Missouri Economic Backdrop: Population, Jobs, and Wages Grow Modestly
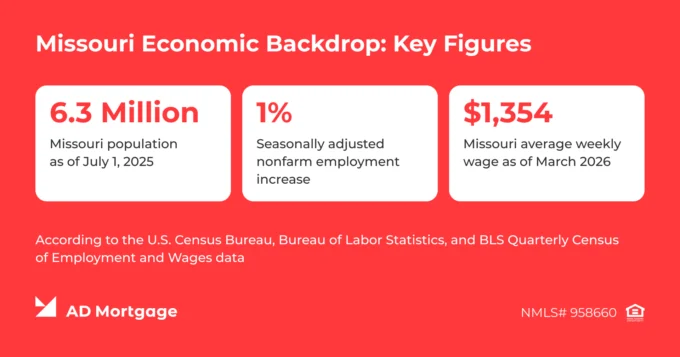
Missouri’s population is steadily growing, reaching 6,270,541 residents in 2025, according to the latest U.S. Census Bureau state estimates. The year-over-year increase was 0.43%, which is a bit lower than the year before – between 2023 and 2024, the population grew by about 0.6%.
Employment also grew year over year. In Q3 2026, seasonally adjusted nonfarm employment averaged 3,012,900 jobs, according to the Bureau of Labor Statistics monthly data. This is an increase of just over 1% compared with 2,982,000 a year earlier in Q3 2025.
Wage growth was moderate – BLS data shows a 3.4% increase in the average weekly wage from $1,310 in March 2025 to $1,354 in March 2026.
Broker Takeaway: The steady growth in key economic indicators supports Missouri’s appeal for investors. In our recent ‘U.S. Real Estate Investment Opportunities by State’ report, Missouri ranked eighth among all states for fundamental investors.
Market trends can provide useful context, but every transaction ultimately comes down to the borrower’s individual financial situation. If you have a scenario that may require a different financing approach, AD Mortgage can help you explore the available options.
Missouri Housing Inventory Expands as Market Conditions Hold Steady
The average number of active listings hit 20,678 in the quarter, up 6.3% compared with 19,460 in Q3 2025, according to Realtor.com state inventory series data. Overall, this increase suggests more choice and potentially greater negotiating leverage for buyers.
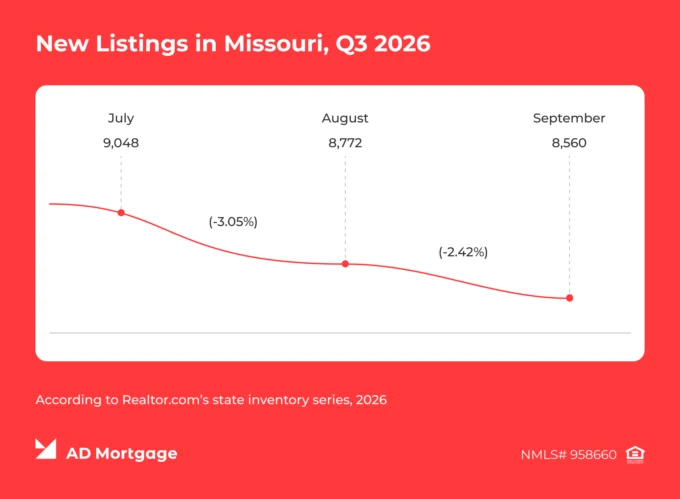
However, this indicator should not be evaluated alone, as it is closely connected to two other indicators – new listings and days on the market. In Q3, both showed little year-over-year change. The average monthly number of new listings reached 26,380, up 0.86% compared with Q3 2025, while the monthly median average days on the market increased to 54.7, up 1.9% from a year ago.
Broker Takeaway: Despite the increase in active listings, other indicators do not yet point to a clear shift toward a buyers’ market. Although negotiating power may not have increased significantly, the broader choice gives borrowers more flexibility when selecting a property.
Missouri Home Prices Rise Year Over Year as Sales Hold Steady
The average of the regional median sale prices decreased over the quarter, from $292,400 in July to $284,287 in September, according to Zillow data. However, the quarterly average increased by 3.8% year over year – from $278,634 in Q3 2025 to $289,329 in Q3 2026.
The number of homes sold, reported by Zillow, totaled 22,899 in Q3 2026, virtually unchanged from 22,919 in Q3 2025.
Broker Takeaway: Sale price growth is only part of the picture. When discussing a scenario, consider the borrower’s homeownership costs, including property taxes and insurance, which affect the monthly payment. In Missouri, property taxes average 0.91% of home value, while homeowners insurance averages about $3,783 annually for $300,000 in dwelling coverage.
Missouri Homeownership Rate Stays Within Its Recent Range
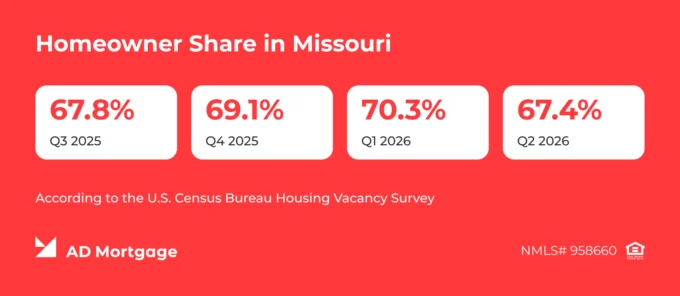
Missouri’s homeownership rate remained within its recent range of approximately 67% to 71%, declining from 70.3% in Q1 2026 to 67.4% in Q2 2026, according to the U.S. Census Bureau’s Housing Vacancy Survey.
Additionally, 58.8% of owner-occupied housing units had a mortgage in 2024, as reported by the U.S. Census Bureau.
Broker Takeaway: Missouri offers opportunities to serve borrowers with a range of financing needs – from financing a home purchase to accessing equity through a second mortgage or purchasing an investment property to serve renter households.
Whatever the scenario, AD Mortgage is here to help you find the right mortgage solution. Submit a Scenario Request, and we will contact you within 30 minutes with a tailored financing option.
Missouri Housing Market Outlook: What Brokers Should Watch in Q4 2026
While the overall market changed little, some changes – such as growth in active listings – may shape future trends. These key indicators will help brokers keep their fingers on the pulse of the market:
- New listings and active inventory trends help brokers assess how much choice buyers have and whether there is room to negotiate terms. If supply continues to expand through Q4, buyers may gain more negotiating leverage, particularly if homes also take longer to sell.
- Days on the market also help brokers assess buyers’ negotiating power. Watch whether selling times increase in Q4, as homes that take longer to sell may offer more room to negotiate prices or seller concessions.
- Prices and completed sales show whether the wider selection is translating into more transactions. Watch whether prices continue to ease in Q4 and whether sales pick up after remaining virtually unchanged year over year in Q3.
Broker Takeaway: Use statewide trends as context, then focus on the borrower’s target area and price range. More choice does not automatically mean a better deal – compare available properties, potential negotiating opportunities, and total monthly housing costs.
To help your client find the right mortgage solution, use Quick Pricer Pro in the AIM Partner Portal to price your loans quickly.
Not a Partner yet? Complete the Broker Package and get access to innovative tools for an efficient loan workflow.