
Post content:
Ohio Housing Market Report: The Details Loan Officers Need to Know
Add AD Mortgage as your preferred source on Google
During Q3 2026, Ohio’s housing market showed several positive trends, including employment growth, rising wages, and an increase in active inventory.
These factors make Ohio attractive to income-focused investors, placing the state among the top five real estate investment opportunities, according to AD Mortgage’s recent ‘U.S. Real Estate Investment Opportunities by State’ Report.
Today’s broker report analyzes Q3 2026 market trends and outlines what they could signal for MLOs and their clients as Ohio enters Q4.
Ohio Economy in Q3 2026: Steady Job Growth, Wages Just Ahead of Inflation
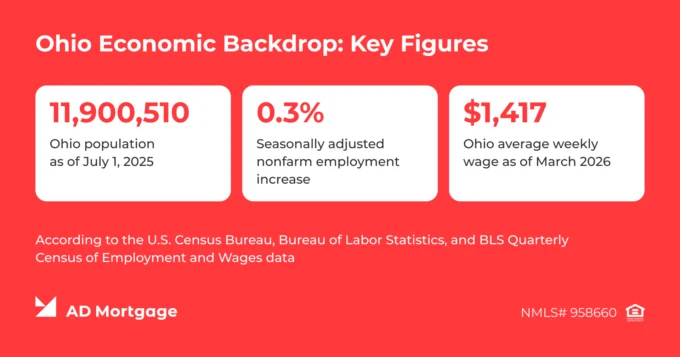
Ohio’s population grew 0.34% year over year, reaching 11,900,510 in 2025, according to the latest U.S. Census Bureau state estimates. Adults account for about 78.7% of the state’s population, or roughly 9,368,603 people based on Census estimates.
Employment has followed a similar pattern, with steady year-over-year growth. The Bureau of Labor Statistics reports that seasonally adjusted average nonfarm employment grew by 0.3% to 5,689,400 in Q3 2026, very similar to growth in Q3 2025.
Following the positive trend in population and employment, the average weekly wage rose 4% year over year. According to the latest BLS report, the average weekly wage reached $1,417 in March 2026, compared with $1,362 in March 2025.
Broker Takeaway: Overall, Ohio’s market is growing. However, the wage increase only slightly surpasses national inflation of 3.7%. That limits how quickly housing demand can accelerate, even as population and employment rise.
Market trends can provide useful context, but every transaction ultimately comes down to the borrower’s individual financial situation. If you have a scenario that may require a different financing approach, AD Mortgage can help you explore the available options.
Ohio Housing Inventory: More Listings, Longer Days on Market
Active Listings Rose Every Month in Q3
FRED’s monthly active-listings data show a seasonal pattern: inventory typically peaks in October and November and reaches its annual low in March and April. As a result, the third quarter generally represents a buildup toward the fall inventory peak.
According to Realtor.com state inventory series, Ohio’s active inventory rose each month during Q3, from 22,165 listings in July to 23,302 in August and 24,622 in September. Active inventory represents homes currently available for sale, including properties listed in previous months that remain on the market. It provides a snapshot of the supply of homes available to buyers.
New Listings Up 1.2% Year Over Year
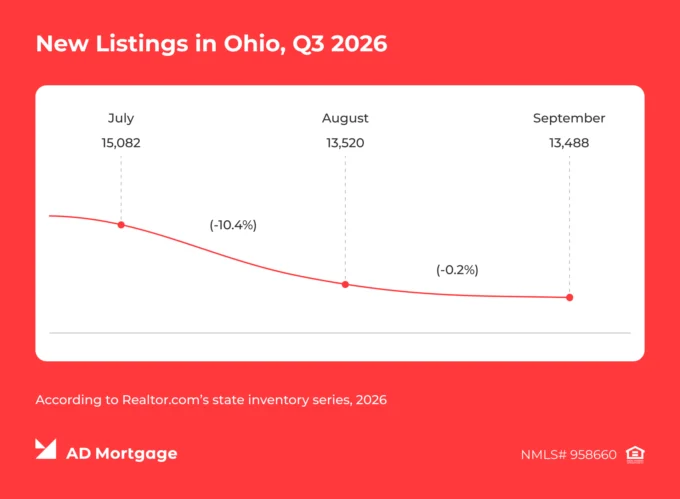
Meanwhile, new listings measure the number of properties newly listed for sale during a given period, offering insight into how much fresh inventory is entering the market. Ohio recorded 42,090 in Q3 2026, up 1.2% from 41,588 in Q3 2025. However, monthly new listings declined from 15,082 in July to 13,520 in August and 13,488 in September, indicating a slowdown in the pace of new properties coming onto the market over the quarter.
Homes Took 43 Days to Go Pending
On average, homes in Ohio went pending after 43 days on the market in Q3 2026, compared with 38 days in Q2 2026.
Broker Takeaway: Modest year-over-year growth in new listings and a longer time to pending indicate potentially greater negotiating leverage for buyers. Brokers may find seller concessions and temporary rate buydowns particularly useful for helping eligible buyers manage upfront affordability and lower their initial monthly payments.
Ohio Home Prices: $227K Median vs. $384K Nationally
Median Sale Price and Home Value Growth
In Q3 2026, Ohio remained relatively affordable compared with the national market. For comparison, the national median sale price reached $384,167. Ohio recorded 35,567 existing home sales at an average regional median sale price of $227,073, according to Zillow. While average home values increased 3.2% year over year.
Property Taxes and Homeowners Insurance in Ohio
Beyond the sale price, ongoing homeownership costs are also an important consideration. Tax-Rates.org estimates that the median annual property tax in Ohio is $1,836, with county-level medians ranging from $692 to $3,732. The average homeowners insurance premium in Ohio is about $2,160 a year.
Broker Takeaway: During periods of economic uncertainty and elevated mortgage rates, affordability remains an important consideration. Brokers can use Ohio’s relative affordability as a conversation starter while focusing not only on the purchase price, but also on total homeownership costs.
Ohio Homeownership Rate Stays Near 70%
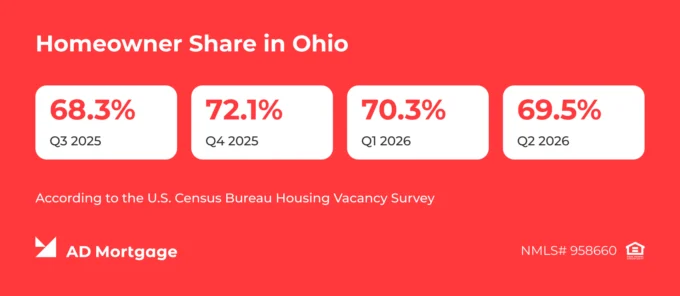
The most recent U.S. Census Bureau Housing Vacancy Survey features the data for the second quarter of Q2 2026. At that point, Ohio’s homeownership rate stood at 69.5%. Although the owner-occupancy rate declined from 70.3% in Q1 2026, the change was minor and remained within the typical range of quarterly variation for the state.
Broker Takeaway: With Ohio’s owner-occupied and renter-occupied shares remaining broadly stable, brokers can continue their usual strategy of serving households seeking a path to homeownership as well as existing homeowners considering a move or refinance.
Ohio Housing Market Outlook: What Brokers Should Watch in Q4 2026
During Q3, the Ohio market shifted toward a more buyer-friendly environment, and brokers should keep an eye on this trend in the next quarter. Will buyers continue to improve their bargaining position when negotiating deals? These three factors can help answer that question:
- New listings are an important indicator of market activity. Pay attention to year-over-year changes to avoid being distracted by monthly fluctuations.
- Days on the market reflect how much flexibility buyers may have when negotiating terms. Monitor how this metric is changing to suggest the most efficient solutions for your clients.
- Sales volume and housing prices can help demonstrate the current state of the housing market. Compare state and national trends to better understand market changes.
Broker Takeaway: While tracking statewide trends, bring the conversation back to the borrower’s individual situation. How are prices changing in their preferred neighborhood? Are there new construction projects nearby? What leverage might they have when negotiating with the seller?
The Quick Pricer will help you quickly review estimated loan terms for a client scenario, compare options from AD Mortgage’s program portfolio, and identify a potential best-fit solution.