Take Our Year-End Survey to Receive 500 Loyalty Points and Exclusive Summary TAKE SURVEY
Tennessee’s housing market tilted toward buyers in the third quarter. Compared to Q2, closings fell by 3,000, homes sat on the market 9 days longer, and sale prices fell 1.4%.
Those numbers only tell part of the story. Upon closer inspection, we see that Tennessee’s average homebuyer is 54 credit-score points away from the best pricing available, which means a lot of buyers aren’t getting the full benefit of a market that’s tilting their way according to an AD Mortgage study on Credit Score vs. Mortgage Rate.
In this report, we discuss:
Tennessee’s Q3 2026 price trends, and what a 1.4% quarterly decline means heading into Q4
Inventory and median days on market, and where buyers are gaining negotiating room
The migration and job growth keeping demand steady even as the market cools
Who’s buying in Tennessee based on Tennessee Housing Development Agency’s (THDA) latest mortgage study: the loan types buyers are using, how many rely on down payment assistance, and where investor activity concentrates
A Q4 2026 and 2027 forecast for brokers working on Tennessee files
Looking for the products to match your scenarios? Become a Partner with AD Mortgage for loan options that fit your Tennessee borrowers.
The Q2 estimated home sales includes an interpolated estimate for April, calculated using February and May sales counts.
Tennessee keeps adding people and jobs, even as the housing market is cooling around them. Tennessee’s population grew by about 64,000 from mid-2024 to mid-2025, reaching 7,315,076, according to the U.S. Census Bureau. Statewide nonfarm employment grew from 3,381,600 in the second quarter to 3,385,500 in the third, per the Bureau of Labor Statistics, and the average weekly wage climbed to $1,426 – up 4.4% year over year as of the first quarter, per BLS wage data.
For brokers, that combination is worth watching closely. Wage growth alone doesn’t solve affordability – a borrower whose income looks solid on paper can still come up short once taxes, insurance, and a realistic debt-to-income ratio enter the picture.
Not every file fits the standard checklist. Send AD Mortgage the numbers, and an account executive will map out which programs fit your client.
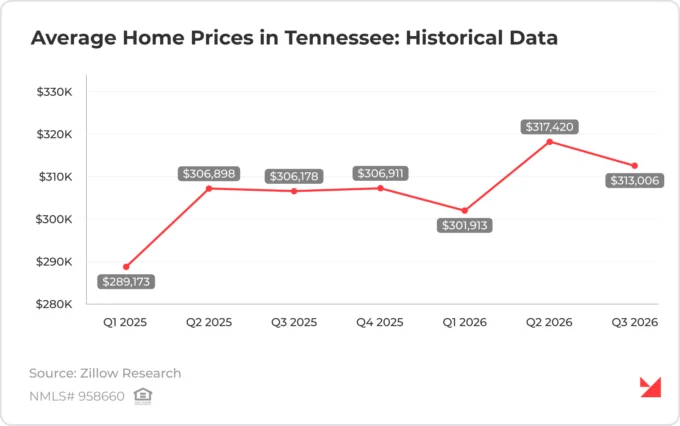
Tennessee’s average home price slipped from $317,420 in the second quarter to $313,006 in the third, according to Zillow Research. This is a decline of roughly 1.4%.
Are Home Prices Dropping in Tennessee?
At this point, it is too early to call this a clear downward trend in prices. The average home price in Q1 2026 was $301,913, notably lower than the Q2 and Q3 figures.
Let’s add 2025 to the comparison. From Q2 through Q4 2025, the average home price held around $306,000. Before that, it grew modestly – from $289,000 in Q1 2025.
Nevertheless, the latest data comparing Q3 to Q2 shows a decline in prices. If this trend continues, sellers will have to give up even more ground, and homebuyers will have more room to negotiate in Q4.
New listings in Tennessee follow a predictable seasonal rhythm. They build through the spring, peak in the second quarter, and taper off through the back half of the year. Q3 2026 followed that pattern with 34,320 new listings (down from 39,442 in Q2), and closed sales eased along with them, from 29,591 to 26,298. Compared with Q3 2025, when 34,378 new listings hit the market, the volume of new housing supply barely moved. At the same time, per U.S. Census Bureau data, Tennessee’s homeowner vacancy rate was 1.2% in 2025.
What a Balanced Market Means for Purchase Negotiations
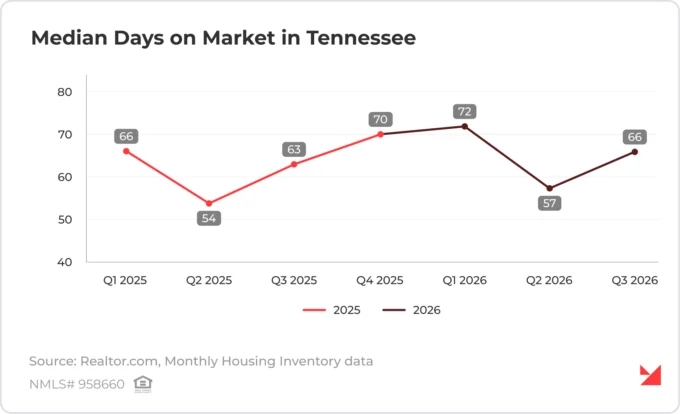
The jump in median days on market from 57 in Q2 to 66 in Q3 looks dramatic in isolation, but the same seasonal swing happened in 2025, when days on market (DOM) rose from 54 to 63 over the same two quarters.
But the more telling comparison is year over year. Every quarter of 2026 has run a few days slower than its 2025 counterpart – 72 versus 66 in Q1, 57 versus 54 in Q2, 66 versus 63 in Q3. Such a gradual softening provides homebuyers with modestly more room to negotiate than they had at this point last year.
Tennessee’s Q4 has historically been the slowest quarter of the year. In 2025, DOM hit 70, the highest of any quarter. So, in Q4 2026, from October to December, brokers can expect at least as much negotiating room as Q4 2025 offered, and likely more, if this year’s pattern of running a few days behind 2025 continues.
What’s Driving the Housing Market in Tennessee
Migration
Tennessee ranked fourth nationally for net domestic migration between July 2024 and July 2025, a net gain of 42,389 residents from other states. That’s more than the state picked up from international migration (roughly 18,000) and natural change (births outnumbering deaths by about 3,600) combined, per Census Bureau estimates.
As we stated above, international migration added a smaller but still meaningful piece. Many new arrivals haven’t built a U.S. credit history yet, because credit scores don’t transfer across borders. This can stall a standard mortgage application even when income is solid. ITIN and Foreign National loan programs might cover this gap, using alternative documentation like bank statements or rent-payment history in place of a traditional FICO score.
Mortgage rates have moved within a wide band this year. But many Tennessee borrowers primarily care about whether the resulting payment fits their budget, and whether their income can qualify for it at all. In 2026, Tennessee’s median household income is $96,820, according to Income by Zipcode data.
About 44.3% of Tennessee renter households are cost-burdened, spending over 30% of their income on housing, per THDA’s 2026 Housing Indicators dataset. That is a sizable pool of renters worth having a buy-versus-rent conversation with, provided they can qualify. And for borrowers with non-traditional income, documentation can matter more than the rate itself.
Property Taxes, Insurance, and the Full Monthly Payment
Tennessee’s lack of state income taxes receives a lot of attention. However, it doesn’t offset property tax and insurance costs that vary sharply by county. A full PITI (principal, interest, taxes and insurance) conversation keeps a pre-approval from falling apart at closing, especially for buyers stretching into a higher price bracket than they expected a year ago.
Who’s Buying in Tennessee? Borrower Profiles for Brokers
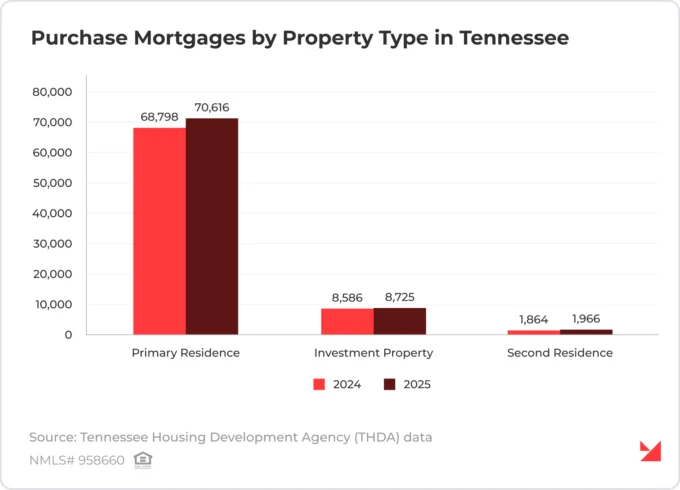
According to THDA Mortgage Report 2025, homebuyers purchasing a primary residence accounted for 87% of Tennessee’s first-lien purchase mortgages for site-built homes in 2025. Investment properties represented 11%, while second homes accounted for 2%. For brokers, owner-occupied purchases remain the largest source of business, with investor opportunities concentrated in particular markets.
Government-Backed Loans Remain a Major Purchase Route
Conventional financing accounted for 61% of mortgages for primary-home purchases in 2025, down from 63% in 2024. FHA held at 22%, while VA increased from 13% to 14%. Together, government-backed programs supported approximately 39% of these purchases.
Lower- and moderate-income borrowers also increased their share of primary-home purchase mortgages, from 22% to 26%. When a borrower’s cash or monthly budget limits the purchase, compare eligible financing routes before settling on a program. THDA identifies debt-to-income ratio as the most common reason for purchase-loan denials, so check how the proposed housing payment fits the borrower’s existing debt obligations.
Down Payment Assistance Serves Buyers with Solid Credit
Among THDA’s own borrowers, more than 96% used assistance resources for their down payment or closing costs in 2025. Their average credit score was 712, and their median qualifying income was $73,171. This is a useful reminder for referral conversations: buyers who need help with cash at closing can still have solid credit.
At the same time, location changes the home search process. Outside the Nashville metro area, 40% of THDA borrowers purchased homes below $200,000, while within the Nashville metro, only 3% did.
Investors and Second-Home Buyers Follow Different Local Patterns
According to the same THDA research, Tennessee lenders originated 8,725 investment-property purchase mortgages in 2025, compared with 8,586 a year earlier. Second-home purchase mortgages rose from 1,864 to 1,966.
From a geographical perspective, THDA identifies ShelbyCounty (with Memphis)and Davidson County (with Nashville)as significant centers of investment-property lending. Sevier County led the state in first-lien second-home originations, followed by Davidson. Thus, a broker should ask about intended occupancy early: a personal vacation home and a rental property require different financing discussions, even when both sit in the same tourist market.
That local growth in investment-property lending tracks with a broader pattern: AD Mortgage’s own 2026 Investment Opportunities by State study also ranks Tennessee among the strongest states for investor activity nationally. To be more specific, Tennessee ranks fifth among all states for Growth Investors, with a score of 64.43 driven mainly by domestic migration alongside home-price appreciation, job growth, and new construction. For Income Investors, the state ranks seventh, at 61.02, a score calculated on rent relative to home value plus rental demand and ownership costs.
To learn more about investment opportunities in Tennessee, explore the full report in the Data Hub.
Tennessee Housing Market Forecast: Q4 2026 and 2027 Outlook
If the price decline between Q2 and Q3 holds into the fourth quarter, sellers will keep giving up ground and buyers will keep gaining room to negotiate. But with the average price still running above where it held for most of 2025, it’s too early to call this a sustained downturn rather than a seasonal pullback.
On median days on market, the pattern is clearer. Tennessee’s Q4 has historically been the slowest quarter of the year, and every quarter of 2026 so far has run a few days behind its 2025 counterpart. Brokers can expect at least as much negotiating room in Q4 2026 as sellers gave up in Q4 2025, and likely more, if that pattern holds. New listings should keep following their usual seasonal taper too, slowing further from Q3’s 34,320 as the year winds down.
The good news is that none of this points to a market in trouble. Tennessee gained a net 42,389 residents from other states between July 2024 and July 2025, and statewide employment kept growing into Q3.
What’s more likely to shift is who’s buying. Between 2024 and 2025, conventional financing’s share of Tennessee purchase mortgages slipped from 63% to 61%, while VA loans grew from 13% to 14% and lower- and moderate-income borrowers’ share rose from 22% to 26%. If affordability stays tight (and with 44.3% of Tennessee renters already cost-burdened, it’s likely to), expect that shift toward government-backed and assistance-reliant financing to continue into Q4, with debt-to-income ratio remaining the most common reason purchase loans get denied.
If DTI is standing between your Tennessee borrower and a closed Q4 deal, AD Mortgage can help you structure around it. Reach out to our account executives before the year-end crunch hits.
Tennessee’s housing market tilted toward buyers in the third quarter of 2026. The average home price eased 1.4% from Q2 to $313,006, closed sales and new listings both slowed, and homes took about nine more days to sell. In particular, in September 2026, the median days on market for homes in Tennessee was 68 days. Also, the number of newly listed homes in Tennessee decreased by 4.3% year over year.
Housing supply hasn’t collapsed (listings followed their usual seasonal taper) but housing demand has cooled enough that sellers are giving more ground at the table. In September 2026, there were 40,680 homes for sale in Tennessee. Homeownership climbed to 68.0%, per the Census Bureau’s Housing Vacancy Survey, while rental share fell to 32.0%. Over the past year, population grew 0.88% and the state added a net 42,389 residents from other states.
What is the average home price in Tennessee?
The average home price in Tennessee was $313,006 in Q3 2026, per Zillow Research, down from $317,420 in Q2. That’s still above most of the past year: 2025’s average held around $306,000 from Q2 through Q4 after starting near $289,000. In 2026, Tennessee’s median household income is $96,820, so the typical home price runs above three times what a typical household earns. These figures are updated every quarter, so the percentage change can shift as more sales close.
Are house prices in Tennessee coming down?
It’s too early to call this a clear or long-term downward trend. Tennessee’s average home price fell roughly 1.4% between Q2 and Q3 2026, but it’s still higher than for most of the past year. In particular, in September 2026, median homes prices in Tennessee were $330,844, according to Zillow.
If the decline continues into Q4, buyers will likely find more room to negotiate, but one quarter of softening doesn’t mean prices are headed into a decade-long slide. Population and job growth haven’t reversed, which argues against a sharp drop in the near future.
Where is the most affordable housing in Tennessee?
Affordability varies by county. Outside the Nashville metro, 40% of Tennessee Housing Development Agency borrowers bought homes under $200,000 in 2025, versus just 3% within the Nashville metro. That leaves meaningful affordable supply in the markets outside Middle Tennessee’s biggest job center. Homes at the same purchase price can carry different property tax bills because local rates and each home’s tax assessment vary. A local agent who works these submarkets regularly is often the best resource for finding where affordable housing supply sits.
Is Tennessee a good state for real estate investors?
Tennessee shows real investor activity: lenders originated 8,725 investment-property purchase mortgages in 2025, up from 8,586, concentrated mostly in Shelby and Davidson counties. Second-home mortgages grew from 1,864 to 1,966, with Sevier County leading the state. An experienced local agent can help determine whether a property fits a buy-and-hold rental strategy or a short-term vacation rental, since financing might differ for each.