
Washington Housing Market: Broker Report For Q3 2026
Washington buyers had more room to shop in the third quarter of 2026. Monthly median sale prices moved lower each month, yet the quarter’s average monthly median held at $599,945. New listings slowed, but active inventory kept climbing, and homes sat on the market longer than they did in July.
For brokers, that combination called for testing every buyer’s budget against current closed sales and the full cost of owning the home. A property that looks more affordable on paper can still carry taxes, insurance, and HOA dues that change what a borrower can close on.
A quarter like this one rewards brokers who check the numbers early. At AD Mortgage, we can review a scenario with you while there’s still room to adjust the numbers. Bring a file that doesn’t fit the standard box, and the team will walk through the options with you.
Statewide Growth Doesn’t Set a Borrower’s Budget
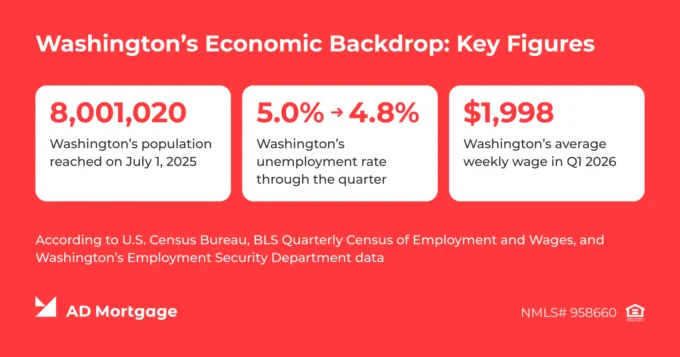
Washington’s population reached 8,001,020 on July 1, 2025, according to U.S. Census Bureau state estimates, up 0.5% from 7,958,180 a year earlier. A separate Census table counted 6,366,184 residents age 18 or older.
Washington’s unemployment rate eased through the quarter, from 5.0% in July to 4.9% in August and 4.8% in September, according to the state’s Employment Security Department.
Statewide average weekly wages reached $1,998 in the first quarter of 2026, the latest period on record, up 2.7% from a year earlier, according to the BLS Quarterly Census of Employment and Wages.
Broker Takeaway: Compare the borrower’s documented income and other obligations with the full proposed housing payment. Statewide growth describes the broader economy, but it doesn’t confirm what one household can afford.
Buyers Had Longer to Choose as New Listings Declined
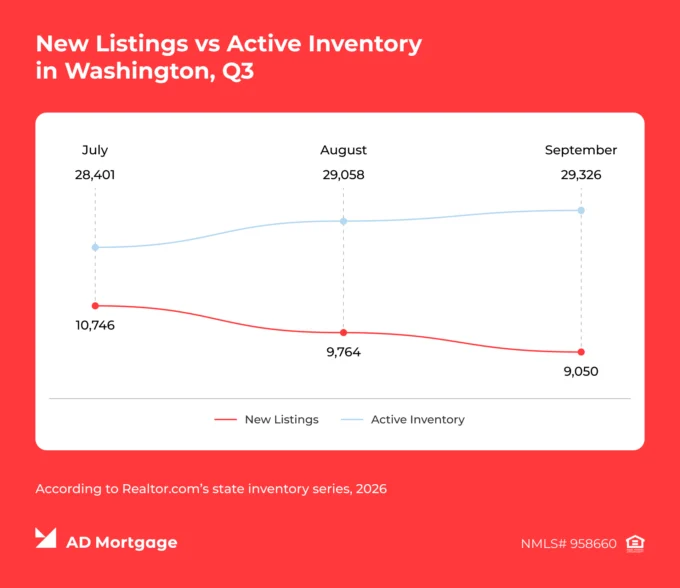
Washington recorded 29,560 new listings in Q3, according to Realtor.com’s state inventory series. Monthly additions fell from 10,746 in July to 9,764 in August and 9,050 in September. Active inventory still grew, climbing from 28,401 in July to 29,326 in September. Fewer new listings each month did not shrink the total pool of homes for sale.
Median days on market increased from 50 in July to 54 in August and 58 in September, averaging 54 days across the quarter. That eight-day increase gave buyers a longer window to compare homes and weigh property costs, though conditions still vary by market: a home’s condition, location, taxes, or association dues can change the budget it requires even at a similar asking price.
Broker Takeaway: Update the payment estimate for each property a buyer considers. Use the longer search window to resolve income documentation and available cash, then revisit the financing terms once the buyer has a specific home and offer price.
Buyers are taking more time to decide this quarter. Send a buyer’s numbers to AD Mortgage for a review before the offer goes in.
More than 20,000 Homes Sold as the Average Monthly Median Held Near $600,000
Redfin’s Housing Market Tracker recorded 7,050 homes sold in July, 6,963 in August, and 6,924 in September, for a Q3 total of 20,937. Monthly median sale prices declined from $609,680 in July to $599,950 in August and $590,204 in September, averaging $599,945 across the quarter.
Broker Takeaway: Review recent closed sales before building a financing scenario around an asking price. A lower purchase price can change the required cash and payment, but the borrower still needs a budget that covers taxes, insurance, and any association dues.
Q3 Pricing in Seattle, Spokane, and the Tri-Cities
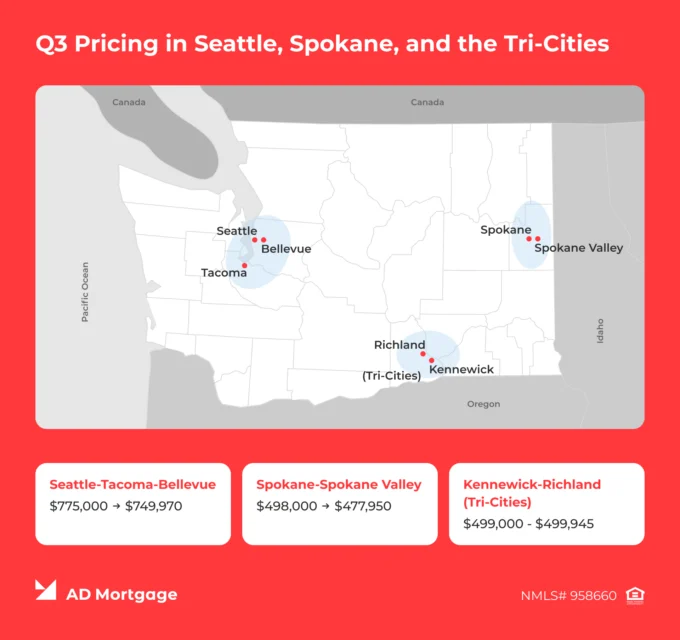
Metro-level data shows how differently Washington’s markets moved this quarter. In Seattle-Tacoma-Bellevue, the median listing price fell from $775,000 in July to $749,970 in September, according to Realtor.com data via the Federal Reserve. Days on market there climbed from 44 to 51, still faster than the statewide average of 58.
Spokane-Spokane Valley saw a steeper percentage drop, from $498,000 in July to $477,950 in September, according to the same series. In the Tri-Cities, the Kennewick-Richland metro barely moved, holding between $499,000 and $499,945 through July and August, according to Realtor.com data.
Broker Takeaway: A buyer comparing Seattle and Spokane listings is working with two different markets moving at two different speeds.
What Washington Brokers Should Watch in Q4
Three indicators carry into Q4:
- New listings: Will monthly additions keep falling below September’s 9,050, or level off?
- Days on market: If homes keep taking longer to sell, buyers may gain more room to negotiate.
- Closed sales and prices: Monthly medians fell through Q3. The next quarter will show whether that continues or the market steadies near September’s $590,204.
Local conditions still matter most. A buyer in Seattle can face a different market from one in Spokane or a smaller county, so statewide figures work best as a starting point for the conversation.
Broker Takeaway: Use this report to frame the conversation, then bring it back to the borrower’s specific market and financial profile. With buyers taking more time to decide, you can add value by comparing scenarios, walking through the full cost of ownership, and matching the financing to both the property and the borrower’s long-term budget.
Washington’s market shifts every quarter. Review the file with your Account Executive and match it to the AD Mortgage program that fits the borrower.