
South Carolina Housing Market: Q3 2026 Broker Report
Share Your Voice Take Our Year-End Survey to Get 500 Loyalty Points and Exclusive Summary
TAKE SURVEY
South Carolina gave buyers a longer window to consider a purchase in Q3 2026, even as new listings fell toward the quarter’s end. Homes remained on the market longer, and the average of the quarter’s monthly median sale prices was $345,895. Brokers had time to prepare borrowers carefully, but statewide prices and days-on-market figures still required local context before making an offer.
A shifting market rewards brokers who partner with flexible lenders. At AD Mortgage, we help you navigate changing market conditions with fast approvals, dedicated support, and specialized Non-QM and Conventional loan options. Partner with us to provide your clients with a competitive edge in South Carolina.
Volume is Down, but Prices aren’t: Winning South Carolina Borrower Scenarios
Home sales across South Carolina stayed active throughout the third quarter, with the latest September report from South Carolina REALTORS recording 24,539 total closed sales. Sales peaked in July at 8,869 closed transactions, followed by 7,969 in August, and finished at 7,701 in September.*
As for pricing, home values held steady right below the $350,000 mark:
- $348,400 in July
- $344,290 in August
- $344,995 in September
Taking the arithmetic average of those monthly medians puts the Q3 benchmark at $345,895.
Broker Takeaway: With sales volume slowing but median prices staying ‘stubbornly’ near $345,000, the primary barrier to closing deals in South Carolina is borrower affordability at today’s price floor. For clients shopping in this median range, prioritize debt-to-income (DTI) optimization early. This may include restructuring debt, exploring 1099 or bank statement loan programs for self-employed borrowers, or DSCR loans for eligible investment properties, or leveraging seller credits to pay down high-interest consumer debt at closing.
Local Demographics and Mortgage Readiness in South Carolina
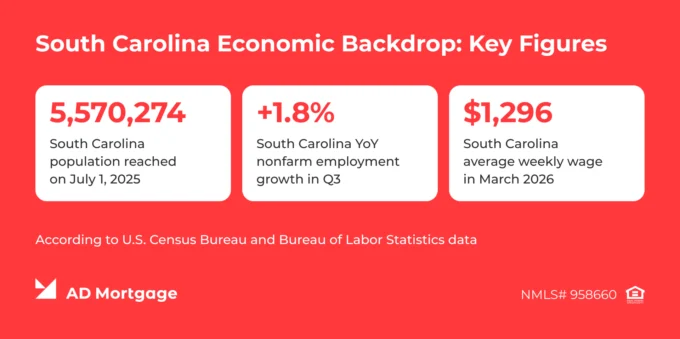
South Carolina’s population reached 5,570,274 on July 1, 2025, according to the U.S. Census Bureau state estimates, with an annual increase of 1.5%. A separate Census table counted 4,421,834 residents age 18 or older. At this point, this is the latest available official data on the state’s population.
Alongside population growth, employment also increased. To be more specific, seasonally adjusted nonfarm payroll employment increased by 1.8% year over year in Q3, according to the Bureau of Labor Statistics state series.
Following the positive trend in population and employment, the average weekly wage rose 4.0% year over year. According to the latest BLS report, the average weekly wage reached $1,296 in March 2026, compared with $1,246 in March 2025.
Broker Takeaway: Rising employment and wages show an expanding pool of qualified buyers. At the same time, statewide averages often hide unique borrower scenarios. Use this growth as a conversation starter, then dig into the borrower’s specific income type, especially for self-employed individuals or those relying on non-standard income sources.
Working with a borrower whose income doesn’t fit standard W-2 guidelines? AD Mortgage offers Non-QM programs for South Carolina’s growing business community.
More Breathing Room for Borrowers
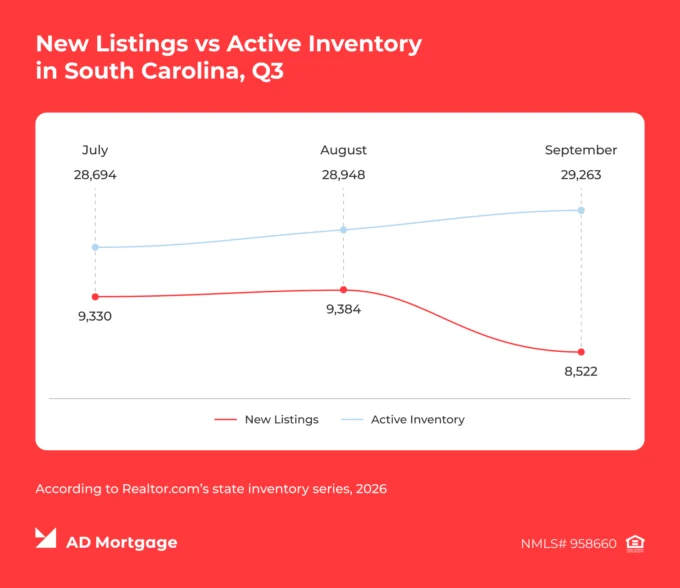
Even though the flow of new properties eased toward the end of the quarter – recording 27,236 new listings across Q3 (starting at 9,330 in July, moving to 9,384 in August, and settling at 8,522 in September, according to Realtor.com’s state inventory series) – buyers certainly weren’t left short of options. In fact, active inventory continued to climb, rising from 28,694 homes in July to 29,263 in September.
Also, borrowers had more time to weigh their choices, as median days on market rose from 65 in July to 67 in August and 68 in September. Averaging out to 66.7 days across the quarter, this little extra breathing room gave buyers an opportunity to compare homes and property costs without feeling rushed.
Broker Takeaway: Active inventory is climbing while new listings slow down. This divergence creates a hidden leverage point: sellers who entered the market earlier in the summer are facing growing competition from accumulated inventory and longer days on market. Use this window to counsel your buyers on competitive yet realistic initial offers. Properties that have lingered past the 60-day mark are prime candidates for price concessions or seller-paid closing cost credits.
At the same time, buyers are taking more time to decide this quarter. Send a buyer’s numbers to AD Mortgage for a review before the offer goes in.
Owners and Renters Face Different Financing Questions
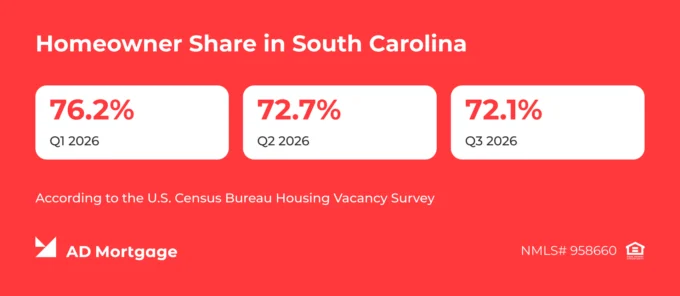
According to the latest Q3 estimates from the Census Bureau’s Housing Vacancy Survey, 72.1% of occupied homes in the state are owner-occupied, leaving a complementary 27.9% renter share.
When working with existing homeowners, focus on timing and coordination. Clients need to unlock current home equity, manage bridge financing options, and transition that capital into their next monthly payment.
With renters and first-time buyers, focus on financial readiness. Their priorities include evaluating savings, improving credit profiles, verifying qualifying income and understanding the full costs of homeownership compared with monthly rent.
What South Carolina Brokers Should Watch in Q4
As you move into Q4, keep a close eye on three key signals across South Carolina:
- New Listing Volume: Watch whether new inventory recovers above September’s 8,522 mark.
- Days on Market: Track whether median time on market stretches beyond 68 days.
- Price Stability: Monitor whether monthly median sale prices remain near the Q3 average of $345,895.
With buyers taking longer to choose a home, keep their pre-approvals current. Subtle shifts in a client’s income, liquid cash, or property tax/insurance estimates can alter their workable budget, even if statewide home prices barely move.
When standard financing hits a wall or a buyer’s profile calls for a flexible path, explore AD Mortgage’s loan programs and walk through the scenario directly with your Account Executive.
* These figures cover the MLS-reported market across both North and South Carolina sources without breaking down specific property types.